

Producing live visuals from a PowerShell REST API
Using vis.js and PowerShell Universal Dashboard

TL; DR
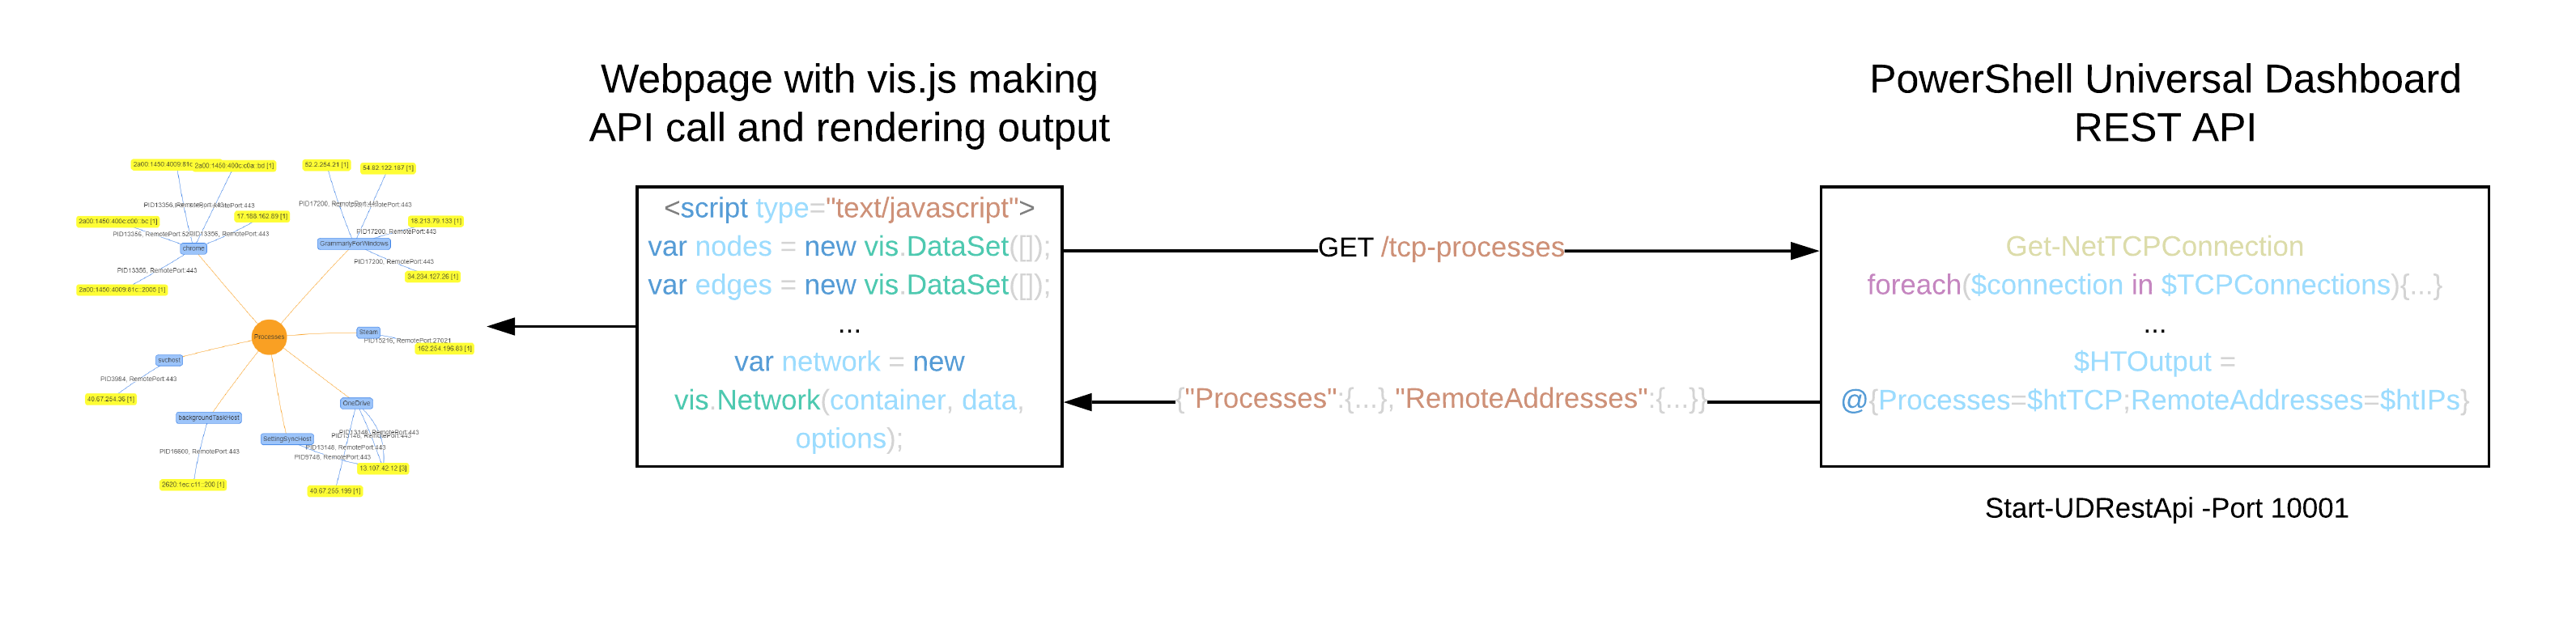
In this post, I’d like to share an example of bringing to life the data returned by an API. One PowerShell example takes the output of Get-NetTCPConnection and Get-Process to create a JSON representation of process IDs and their network connections.
Universal Dashboard provides the means to expose this via REST API. Lastly, the vis.js network module creates a visual representation of this data.
Here is an example video:
You can find the code for this post in this GitHub repository.
Motivation
As part of an as-yet undocumented project, I wanted to create a visual based on REST API served data. I elected to work with a REST implementation I had an experience of in the form of PowerShell Universal Dashboard. This decision would allow me to focus on learning the visualisation library.
TCP connections to port 443
I decided to start with visualising all TCP connections in which the remote port was 443. The PowerShell for this is compact:
$Endpoint = New-UDEndpoint -Url "/tcp-443" -Method "GET" -Endpoint {
    Get-NetTCPConnection | Where-Object{$_.RemotePort -eq 443} | Select-Object RemoteAddress | ConvertTo-Json
}

Start-UDRestApi -Port 10000 -Endpoint @(
   $Endpoint
)
The HTML/JavaScript you can locate in REST-visjs-TCP-443.html file within the GitHub repository.
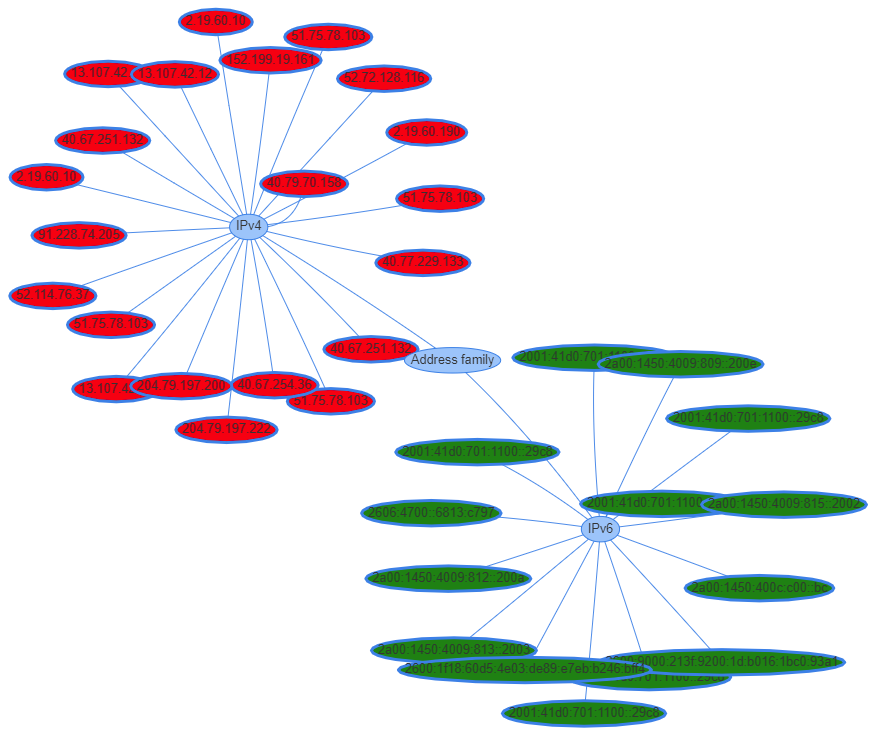
As part of API response processing I test for IPv6 and create edge relationships to the IPv4 or IPv6 nodes appropriately so we can distinguish between the two:
TCP connections with process name and process ID
The intention was to work with the following PowerShell output:
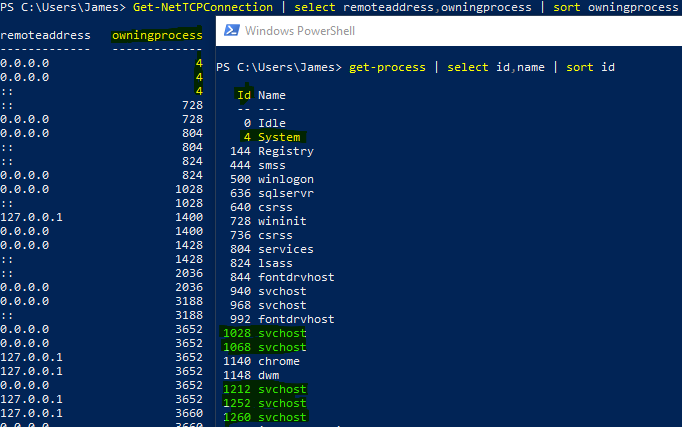
And have it form this graph:
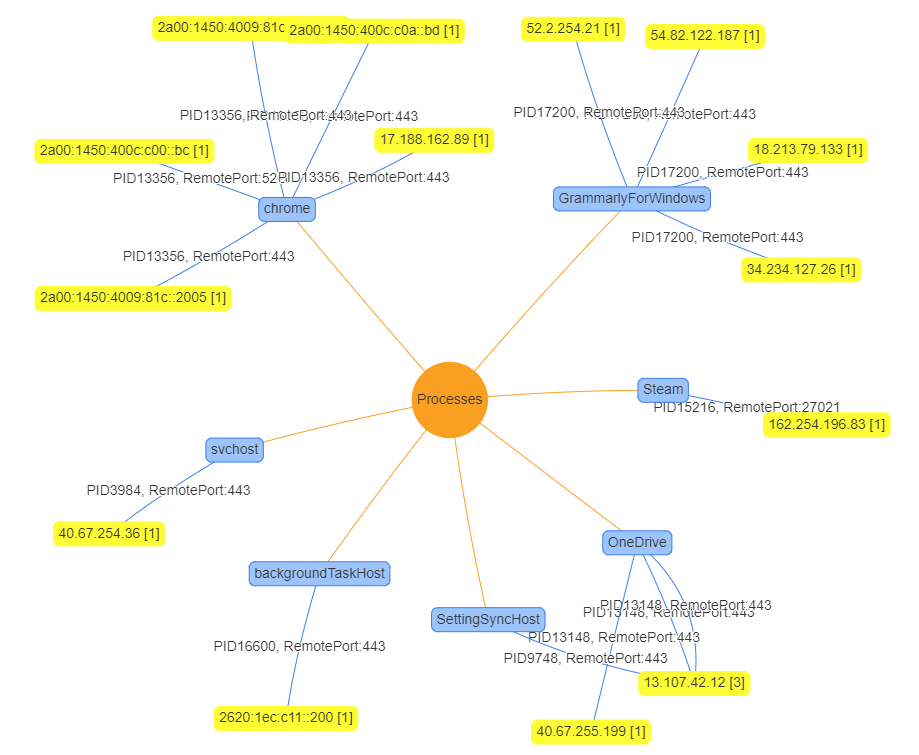
Graph structure
I perhaps didn’t have that same graph in mind when I started. However, I did want to represent process names, process IDs, remote IPs and remote ports in a meaningful way.
When I settled on a two-node depth (process name and remote IP), creating the data structure to support this was greatly simplified. I elected to indicate the source PID and destination port on the edge relationship.
An upside to this approach is that we can see whenever multiple processes share services on the back of the same IP addresses. Additionally, the remote IP address nodes indicate the sum of connections to this address in brackets.
Data structure
PowerShell
The PowerShell data structure is comprised of hash tables and an array as follows:
- Top-level hash table with keys “Processes” and “RemoteAddresses”.
- “RemoteAddresses” is a hash table which records unique IPs and a count of connections using them as their values.
- “Processes” is a hash table of process names.
- A process name is a hash table of process IDs.
- The process ID yields an array of hash tables which describe the remote connection.
JSON output
{
    "Processes":  {"Video.UI":  {
                                    "9432":  [
                                                {
                                                    "remoteIP":  "2.20.92.18",
                                                    "localPort":  "49730",
                                                    "remotePort":  "443"
                                                }
                                            ]
                                   },
                      "Steam":  {
                                    "12476":  [
                                                  {
                                                    "remoteIP":  "162.254.196.68",
                                                    "localPort":  "49798",
                                                    "remotePort":  "27021"
                                                  }
                                              ]
                                }
                    },
    "RemoteAddresses":  {"2.20.92.18":  1,"162.254.196.68":  1,}
}
Conclusion
When I began, this was a stepping stone objective to another learning outcome. I had taken the very basic of examples and shelved the output. The second example I had mocked up but didn’t choose to finish, and I had learned enough to move on to the intended use of vis.js in another project.
Recently I spent some time picking up where I left off to complete the example with process names and PIDs.
I was saddened to learn that the vis.js project status is now end-of-life. Hopefully, the efforts to create separate projects from it will succeed.
Share this post