


Visualising your DNS cache with PSGraph
Exploring how to create a visual with Powershell
TL; DR
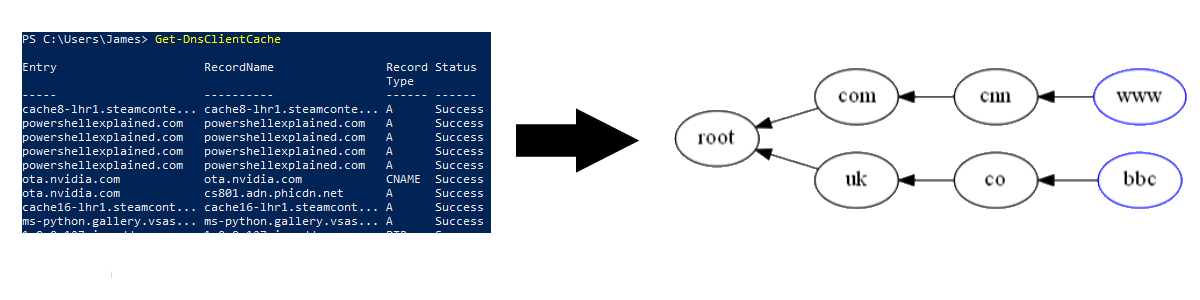
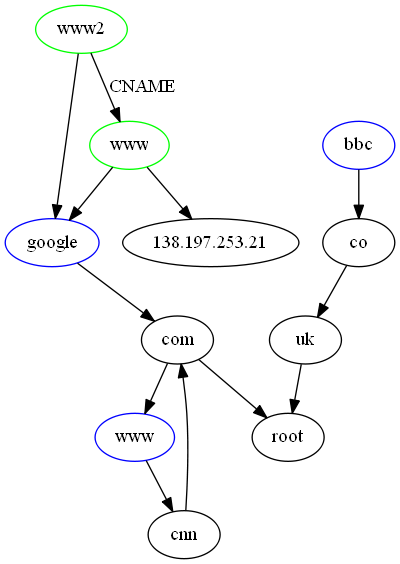
In this post, I’d like to introduce you to how I’ve used PSGraph to create visuals from code. I’ll show you how to represent the Windows DNS cache graphically. Here is an example output (click for a full size image):
Below I cover how to arrive at that outcome. You can find all scripts used at my GitHub page.
Why DNS
The hierarchical nature of DNS (subdomain.topleveldomain.rootdomain) lends itself to graphing. Head over to dnsdumpster if you want to see an excellent example of that.
If you would like a primer on the topic, the most accessible introduction to DNS is probably this comic by DNSimple:
The DNS Cache
One aspect of the protocol is the distributed caching involved. The intention is to decentralise recent lookups and reduce the load on the authoritative origin. The answer for a given query is likely to be the same if recently evaluated. The time for which to cache these answers is known as the time to live or TTL.
One such place to view the DNS cache is in the client operating system.
Accessing the DNS cache from PowerShell
The Get-DnsClientCache cmdlet provides an alternative to the venerable ipconfig /displaydns. It is by this means that we will get access to the Windows OS DNS cache.
Getting started with PSGraph
There is good quality documentation on getting started in minutes. If you are the type of person who learns through examples - you have several examples provided here.
Additionally, Kevin Marquette produced a module with some ready-made examples in PSGraphPlus.
Creating a graph from the DNS cache
Data review
The first thing I considered was the data returned.
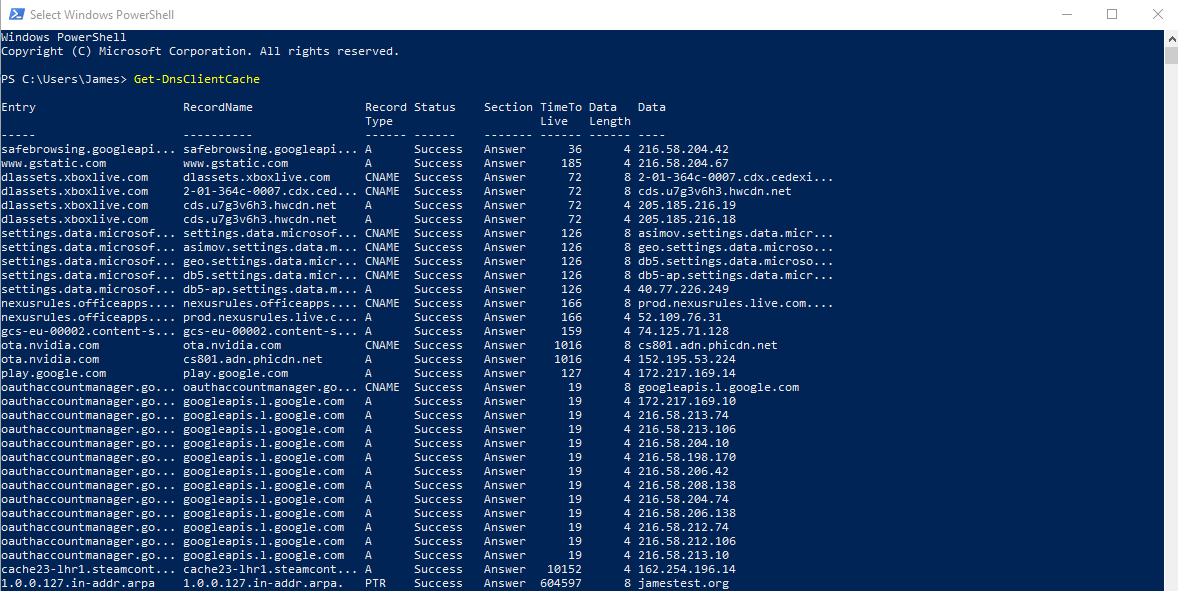
Here are some fields that could be useful as an input:
- Entry
- Record name
- Record type
- data
I elected to omit the following from consideration:
- CNAME results (orange box)
- PTR results (yellow box)
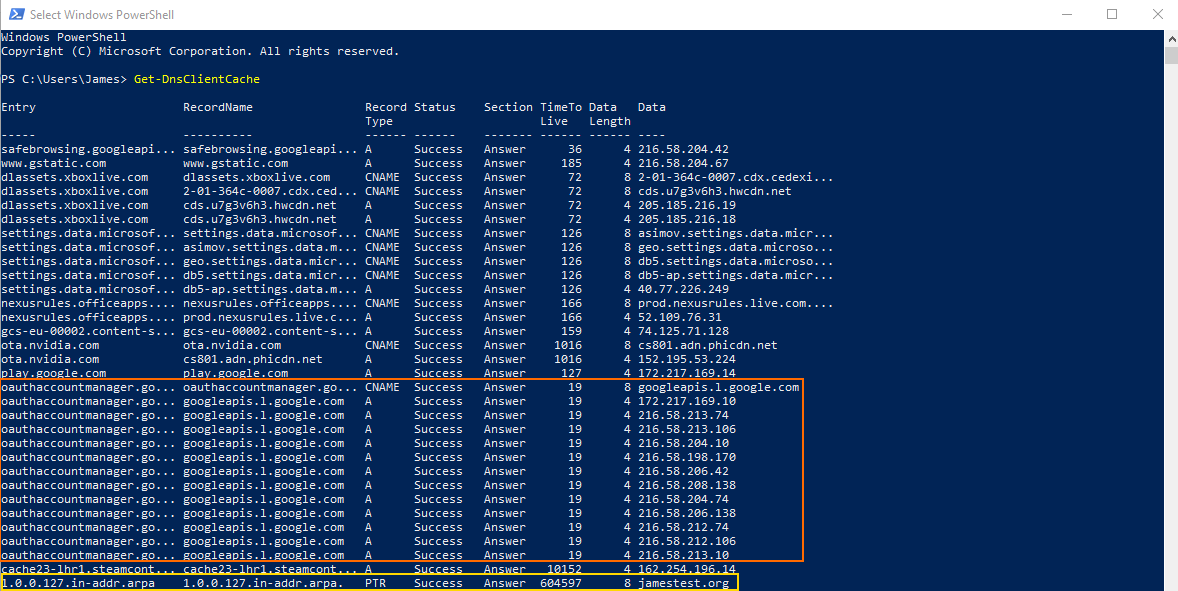
The PTR results I filtered out due to a desire to focus on forward resolution. I ignored CNAMEs for much the same reason. While adding them would add some richness to the story of how an answer was determined - its exclusion simplified the problem and maintained a focus on the original record request.
Therefore it became clear that I should focus solely on the content of the Entry field ignoring only those relating to PTR as a value in Record Type.
The resulting graph would provide a breakdown by domain based on the original DNS request.
Prototyping a graph
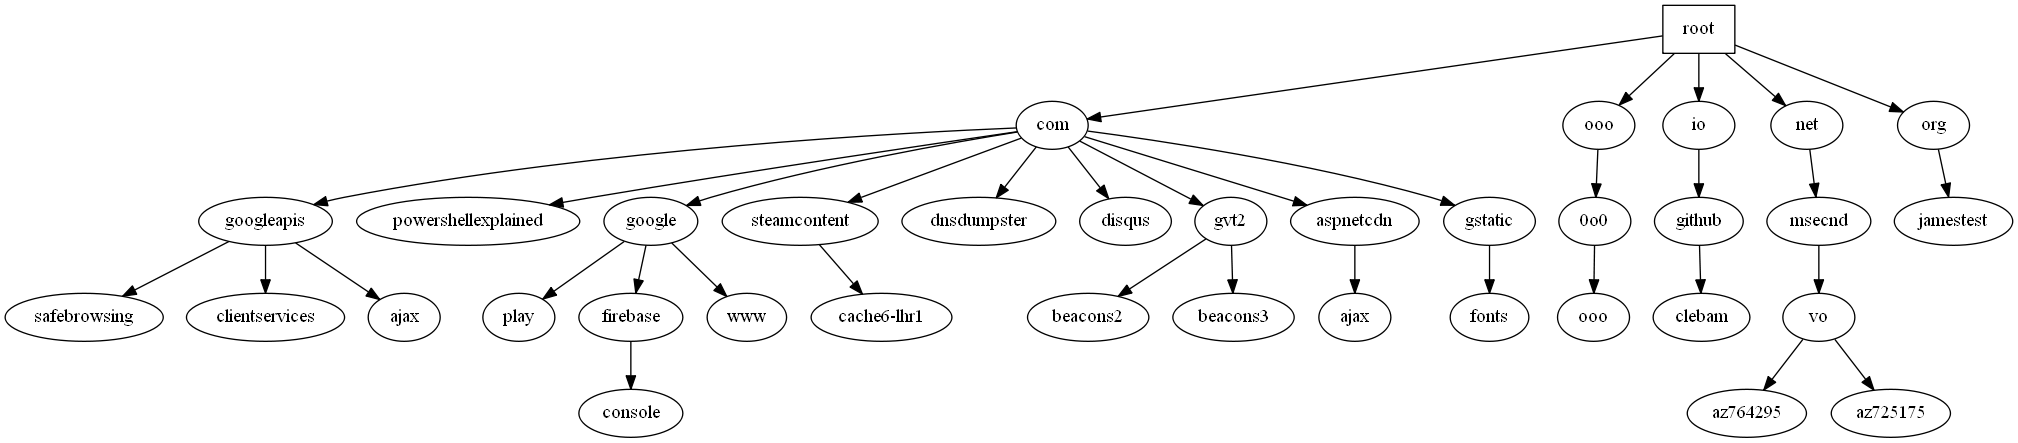
In a perfect world, I would have arrived at the above conclusion before prototyping. The reality is that I experimented with PSGraph and supplied mock input to see how it might look. Here is an example prototype:
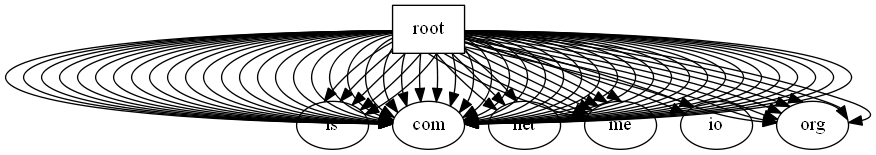
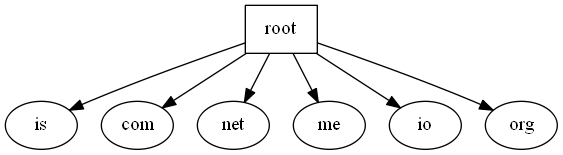
The exercise was useful as I had a clear understanding of how I needed to process the data. One particular lesson was that I should test for existing edges for the same relationship. Otherwise, the effect is additive. Here is an example if I restrict the depth to root domains only with and without unique edge testing:
Prototyping parsing the DNS cache data
Working solely with the Entry field data returned was the first choice. I decided to ignore PTR records during result processing rather than a filter with the query.
I achieved this with the following conditional statement on the value of the Entry field data:
if($result.Entry -like "*.in-addr.arpa")
{#Reverse lookup processing}
else
{#Forward lookup processing}
The second challenge was arriving at the values required for the node values and labels in PSGraph. Let’s consider the following record www.google.com.
First of all, I split them into an array of strings based on ..
$subs = @('www','google','com')
I then want to walk the results backwards to construct the following:
- ID = com, Label = com
- ID = google.com, Label = google
- ID =www.google.com, Label = www
The label will be the array item current indexed. However, the node ID is a string based on a join of the items to this level.
As the labels are what you see in the resulting diagram we achieve the ability to have more than one node with the same visible value (“www” is a prime example) yet retain its relationship with the parent domain.
The code for this prototype is available in WalkDNSCache-loop-proto.ps1 file on my GitHub repository.
Putting it together
TLD processing
I made a conscious choice to process the TLDs (e.g. com/net/io) separately rather than process them in the array walk. The intention was to simplify the loop.
Uniqueness testing
To track unique node IDs, I’m using a hash table. The value element is static at “1” - the thinking was a future version could using the counts of IDs in some fashion.
The code for this prototype is available in WalkDNSCache-psgraph-entry.ps1 file on my GitHub repository.
Conclusion
In this experience, I prototyped to assert my understanding of both the problem and the solution. With two unknowns (how to parse the data and how to utilise the visualisation library), it was a time-efficient means of arriving at a solution.
I’ve left the prototypes in the same repository for transparency in the method applied.
It has been very satisfying, creating a visual from code. I’ve tried to keep this example focused and accessible.
Share this post