


A punnet of raspberries with a side of visuals
Pi-hole and DNS over DNSCrypt with a PowerShell dashboard.
TL; DR
I finally dusted off that Raspberry Pi in the corner. Initially, I was putting Pi-hole through its paces. One thing led to another as a new rabbit hole emerged in the form of adding encrypted transport to forwarded queries (a subject I visited in the past). I purchased another Pi for resiliency. I then explored how I might visualise the performance of the solution.
Lastly, a first for me, I have shared this code on my GitHub page.
Solution overview
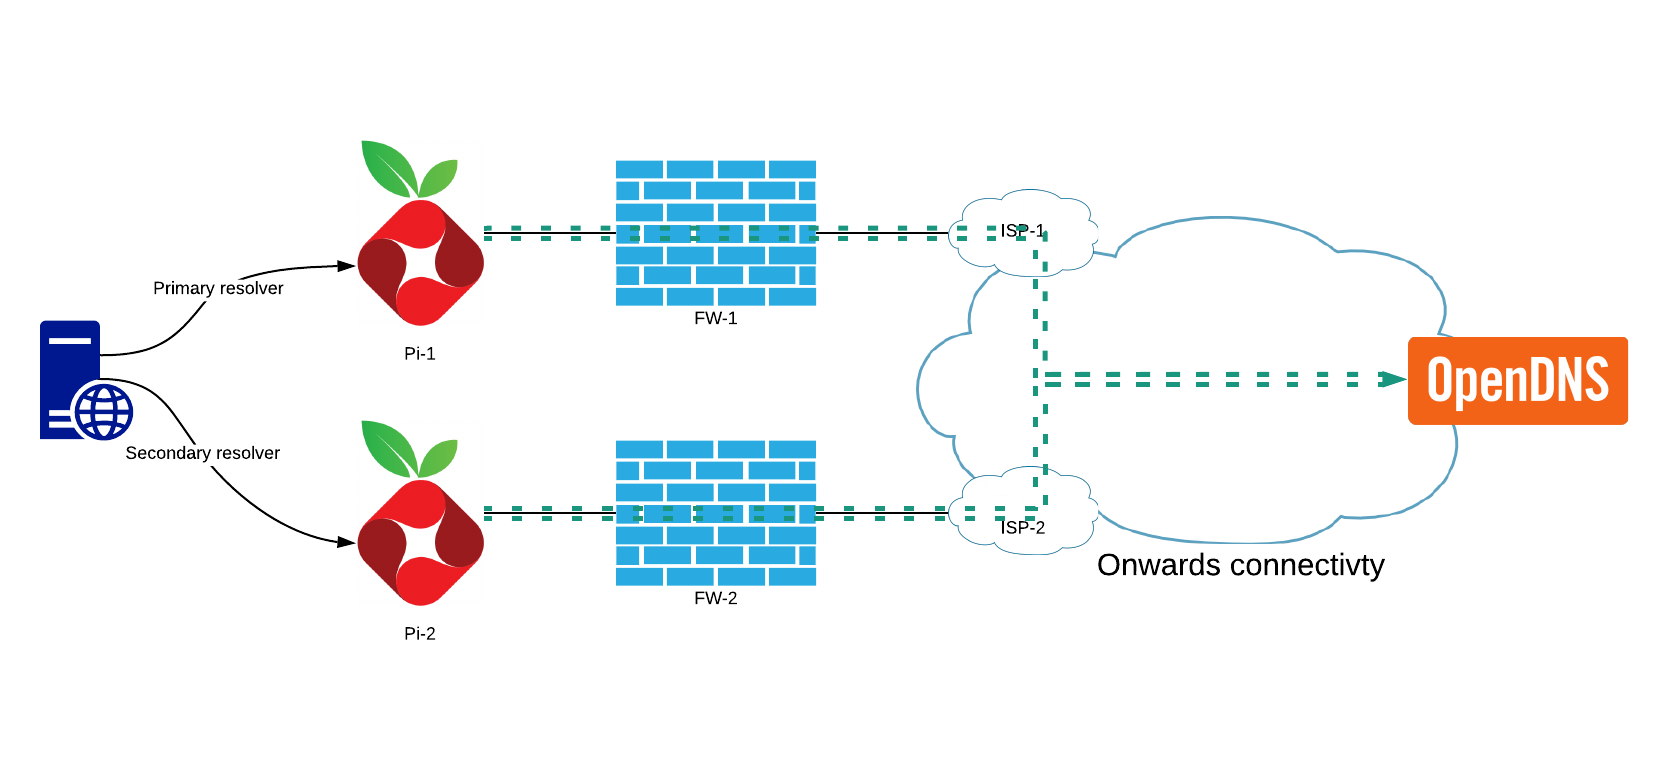
This solution employs the Pi-hole servers as local caching resolvers with their onward traffic divided across ISPs. Each Pi has DNSCrypt acting as a cacheless DNS forwarder to OpenDNS using the DNSCrypt protocol. I am going to forgo a configuration write-up of how to configure Pi-hole with a loopback forwarder as Scott Helme covers this extensively.
DNSCrypt configuration
I followed the Pi-hole GitHub guide with the following deviations from the example configuration file:
- Disable caching
To avoid multiple layers of caching Pi-hole is the only caching layer in the solution. - Ignore system DNS (always use the failback resolver for initial resolvers list)
The operating system uses Pi-hole for DNS. The system DNS, in effect, is set up to use DNSCrypt. Without this configuration, it could not bootstrap itself. It would fail and use the failback resolver. This configuration anticipates that though it is not strictly speaking required.
Addressing a single point of failure
DNSCrypt configuration allows for multiple resolvers with load balancing options. The choice to use one target in OpenDNS is for consistency during testing. It also conveniently provides the debug TXT record which is useful to assert the expected DNSCrypt configuration is effective:
dig @208.67.222.222 -t txt debug.opendns.com +short
"server m21.lon"
"flags 20 0 70 180000000000000000007950800000000000000"
"originid 0"
"actype 0"
"source X.Y.Z.A:64792"
dig @192.168.0.11 -t txt debug.opendns.com +short
"server m29.lon"
"flags 20 0 70 180000000000000000007950800000000000000"
"originid 0"
"actype 0"
"source X.Y.Z.A:43590"
"dnscrypt enabled (716D496B684B3766)"
I have DNS over HTTPS enabled in Firefox allowing for name resolution should there be an issue.
Bonus rabbit hole
I took a moment to consider how to parse the debug response as a rudimentary “what is my IP address?” solution via PowerShell:
$openDNSResponse = Resolve-DnsName -Name "debug.opendns.com" -type TXT -Server 208.67.222.222 -DnsOnly
foreach($answer in $OpenDNSResponse){
    if($answer.Strings -match "source *")
    {
        $strSourceAnswer = $answer.Strings
        $strSourceIPandPort = $strSourceAnswer.Substring(7)
        $strSourceIP = $strSourceIPandPort.Split(":")[0]
    }
}
$strSourceIP
Performance visualisation
I needed a way to visualise network and DNS latency in a time-series fashion. To this end, I created a PowerShell Universal Dashboard visual employing the following PowerShell commands:
Measure-Command {Resolve-DnsName google.com -Server 192.168.0.11 -DnsOnly} | Select-Object -ExpandProperty Milliseconds
I am approximating the DNS query time by measuring the execution time of theResolve-DNSNamecmdlet. The overhead is apparent with local queries and is in the 1-3 ms range when compared to dig for the same request. I specify the-DnsOnlyparameter to restrict the lookup to the DNS protocol.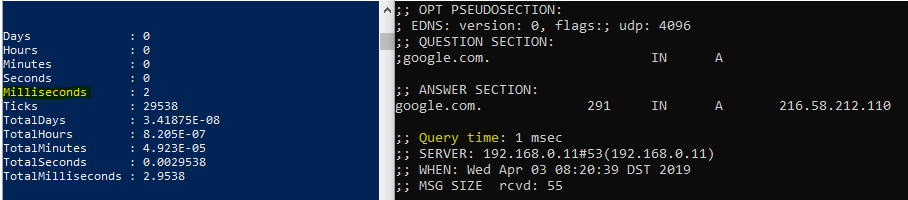
Get-WmiObject -Class Win32_PingStatus -Filter 'Address="208.67.222.222"' | Select-Object -ExpandProperty responseTime
This command gives us the response time for a single ping to a given target.
The Universal Dashboard is a two-row page with UD monitors graphing the results of the above commands with a 1-second resolution.
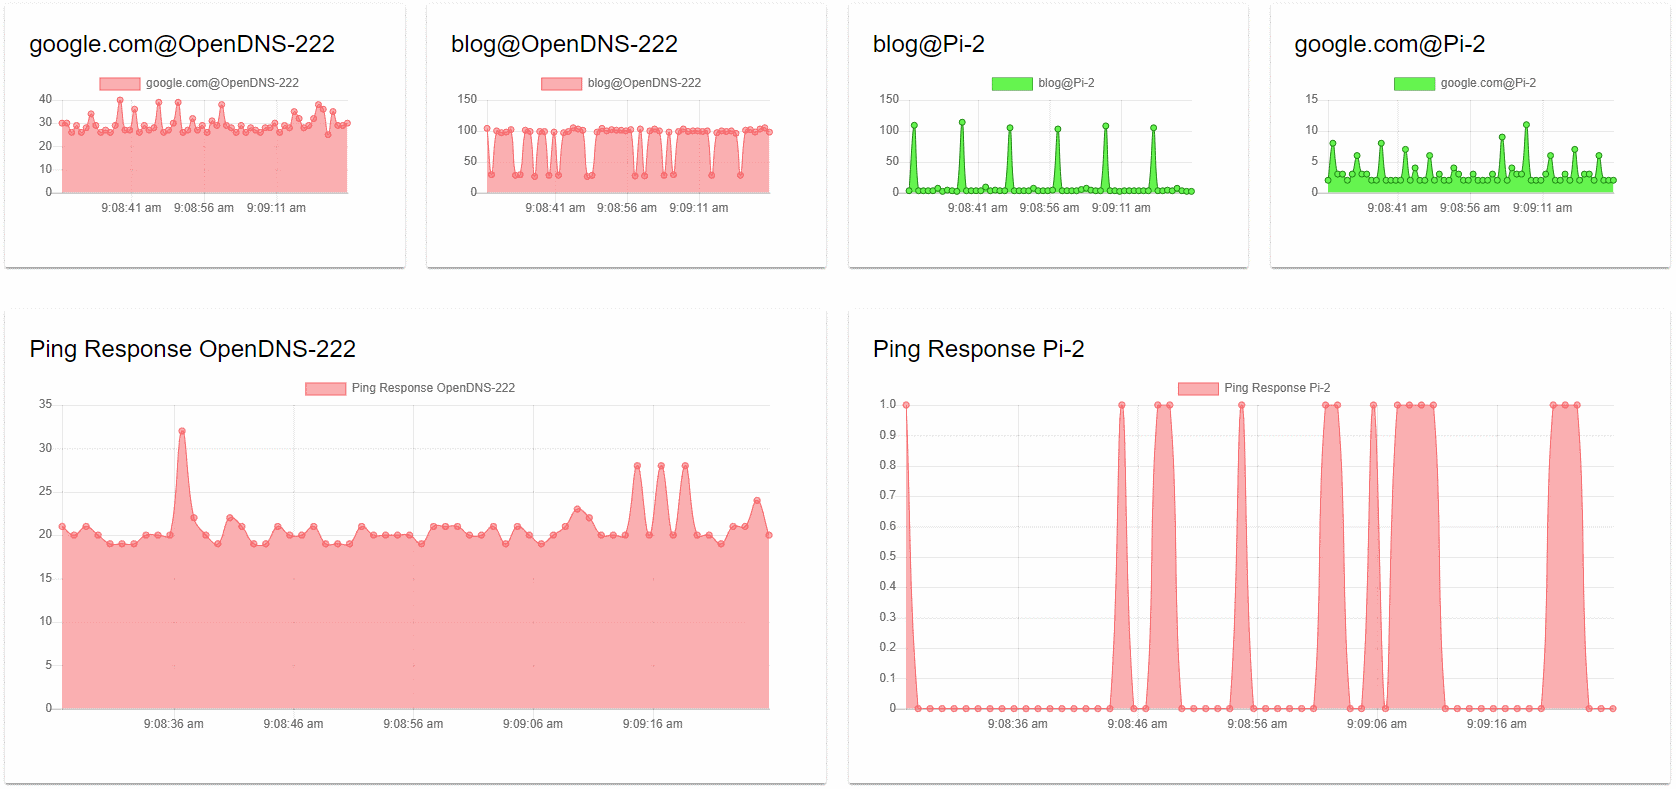
The dashboard, when reviewed as top versus bottom, provides a comparison of the network latency and query resolution times. The bottom half, therefore, refers to our base latency to the target. The top half is the query time from the same target illustrating two different requests.
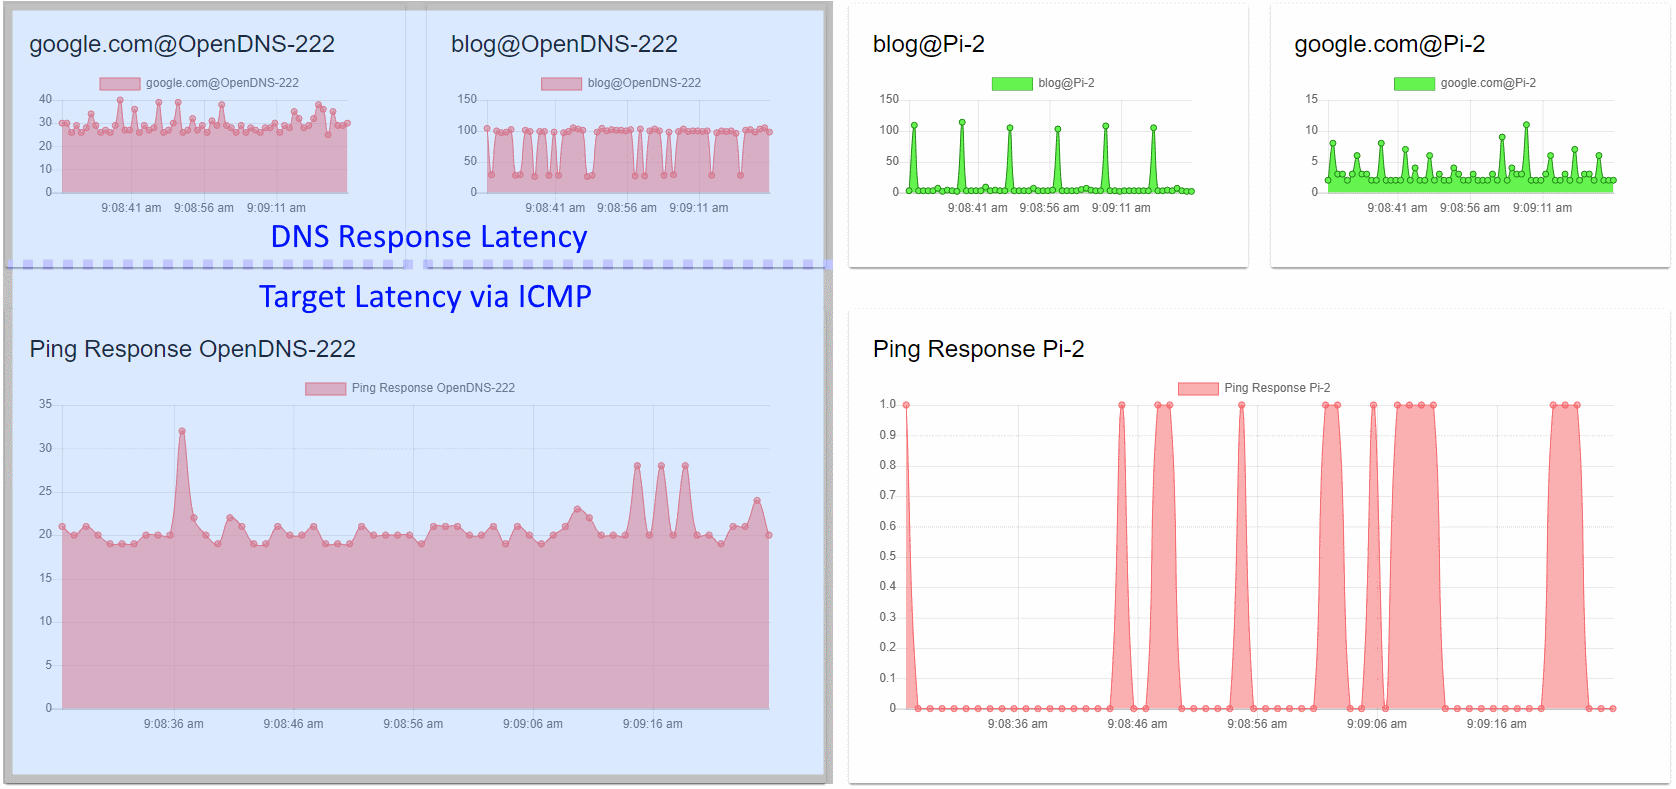
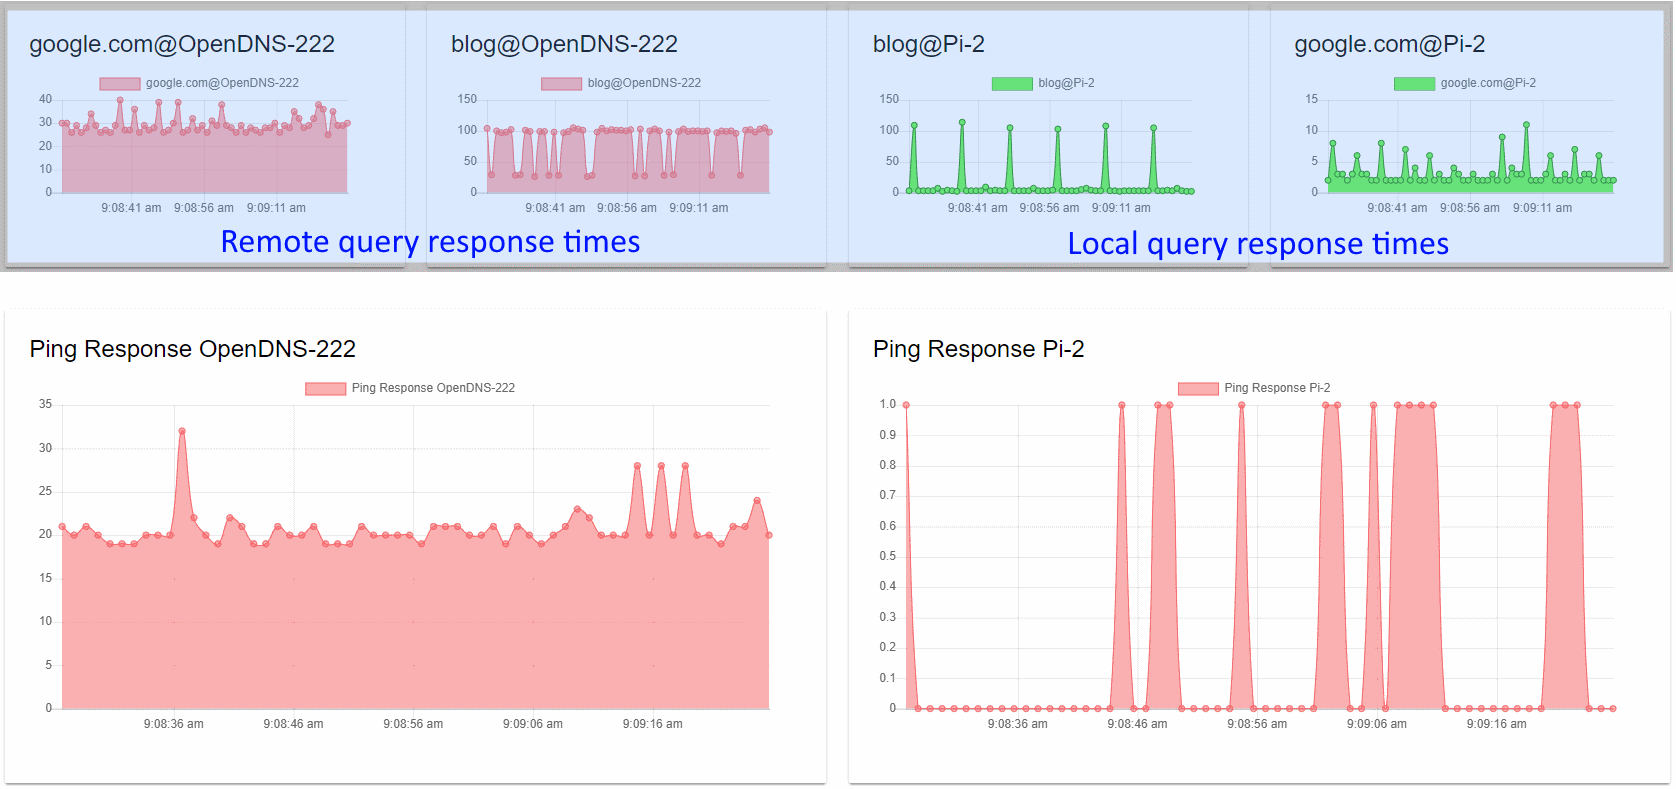
When we review the dashboard as left versus right, we are comparing the performance of remote resolution versus that of local name resolution solutions in the top half. The bottom half compares the base latency to the targets.
Local versus remote resolution
When judging the queries to use, I picked one (google.com) which I’d consider being in the OpenDNS cache due to popularity with a modest time to live (TTL) of 300 seconds. As a contrast, I would compare this to a previously unseen record (blog.mesmontgomery.co.uk) with a very low TTL of 10 seconds.
Google.com
The comparison of local vs remote results for Google are just what you would expect. If we subtract the network latency from the query time, we get an output similar to local query time.
Blog.mesmontgomery.co.uk
The active 10 second TTL is due to the CNAME of mesmontgomery.daaad5.flexbalancer.net.
;; ANSWER SECTION:
blog.mesmontgomery.co.uk. 300   IN      CNAME   mesmontgomery.daaad5.flexbalancer.net.
mesmontgomery.daaad5.flexbalancer.net. 10 IN CNAME ja.mesmontgomery.co.uk.
ja.mesmontgomery.co.uk. 300     IN      A       151.101.1.195
ja.mesmontgomery.co.uk. 300     IN      A       151.101.65.195
The CNAME is a DNS based load-balanced solution called Flexbalancer by PerfOps. These graphs tell an interesting story:
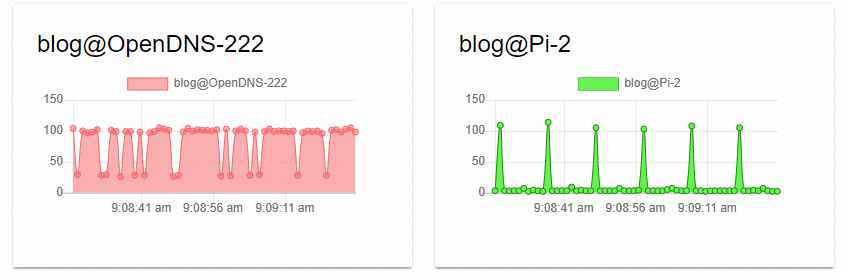
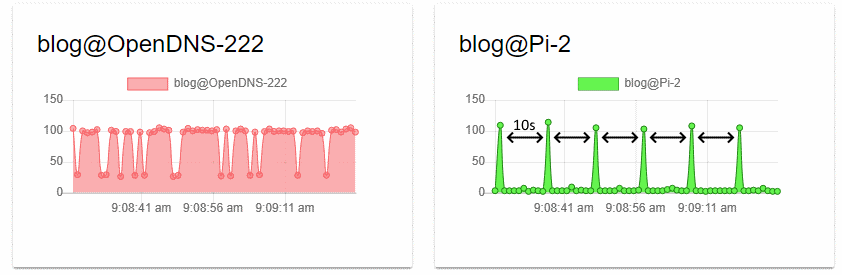
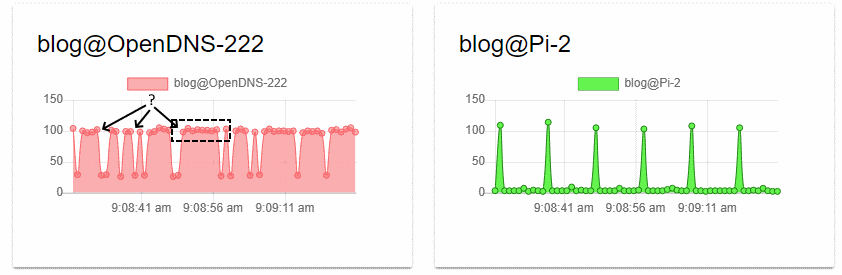
We can observe that the peak query time is the same for both solutions. Manual testing with dig yields query times in the same range:
dig @208.67.222.222 blog.mesmontgomery.co.uk
;; QUESTION SECTION:
;blog.mesmontgomery.co.uk.      IN      A

;; ANSWER SECTION:
blog.mesmontgomery.co.uk. 276   IN      CNAME   mesmontgomery.daaad5.flexbalancer.net.
mesmontgomery.daaad5.flexbalancer.net. 10 IN CNAME ja.mesmontgomery.co.uk.
ja.mesmontgomery.co.uk. 276     IN      A       151.101.65.195
ja.mesmontgomery.co.uk. 276     IN      A       151.101.1.195

;; Query time: 104 msec
;; SERVER: 208.67.222.222#53(208.67.222.222)
We can surmise that we are hitting different OpenDNS resolvers behind the anycast address. The low TTL combined with low query volume does not allow for a high percentage of cache hits. Therefore most queries have the expense of authoritative lookups each time. In the case of a DNS based load balancer, this is deliberate.
In conclusion
It is no surprise to see local caching solutions providing an improved experience. The low TTL effect on query latency may give you food for thought if your recordset is virtually static.
What TTL to query volume ratio would allow for maximum cache hits in fair weather days while minimising the TTL is a rabbit hole for another day.
Thanks to modern tooling via Poshtools in the form of their excellent Universal Dashboard solution - we can create functional ad-hoc visualisation such as these.
Relevant posts
- A QUIC look at DNS
- Using DNS to learn anything
- APIs, automation and UDLA (using DNS to learn anything)
Share this post