Duel stack life - exchanging momentum for speed
The need for speed - analysing the speed differences in AWS vs GCP

TL; DR
I knew duel stacking this site would introduce some challenges. In this case, I found myself chasing speed demons at the expense of a focus on other project time. I’ve enjoyed every minute of it - however, there’s a lesson in there.
Multi-cloud thoughts
This site is a project which began on the one hand as a reason to explore the GCP Firebase hosting product. Extending it to AWS has added a dimension to it whilst still being relevant to the project itself.
Multi-cloud also leads to inevitable comparisons. One might be the speed of operation or perceived performance. This comparison, whilst easy to consider on the surface is fraught with blind alleys and data fallacies. I had previously decided to employ the AWS version of this site in an active-passive manner with manual intervention. I also spent some time considering how I might go about changing posture to automatic failover or even active-active(for science).
Comparing GCP and AWS
Before any of this, I did some fundamental analysis of the site via Google’s own PageSpeed Insights. I later had an introduction to GTmetrix which offered more in-depth insight alongside the same PageSpeed score.
Point in time performance (Canada)
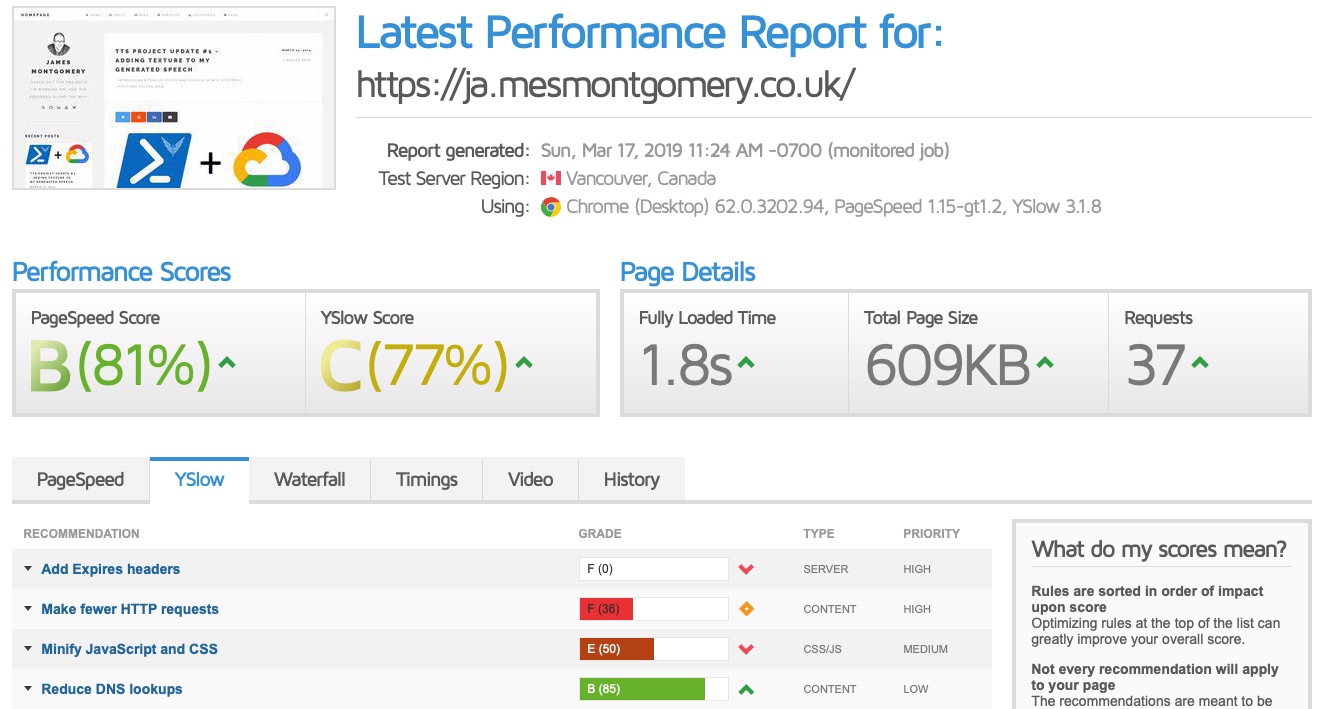
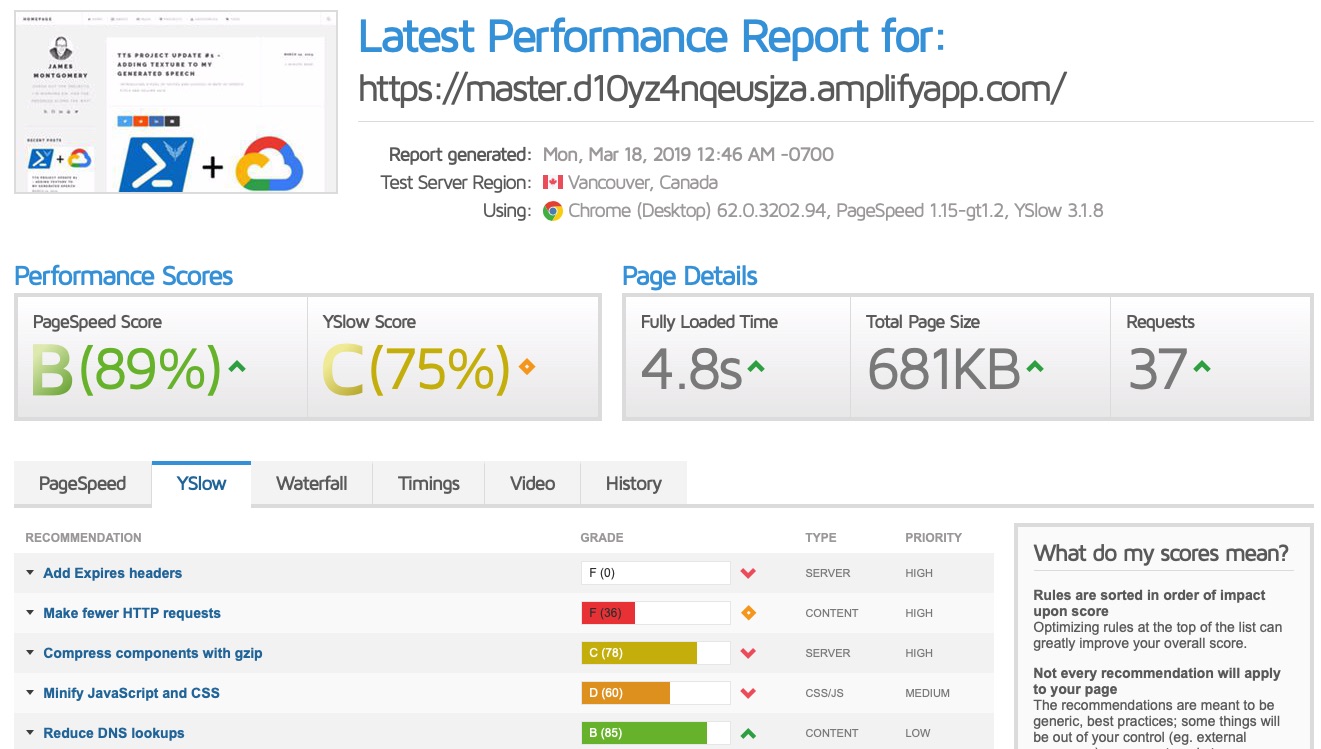
Historical performance (Canada)
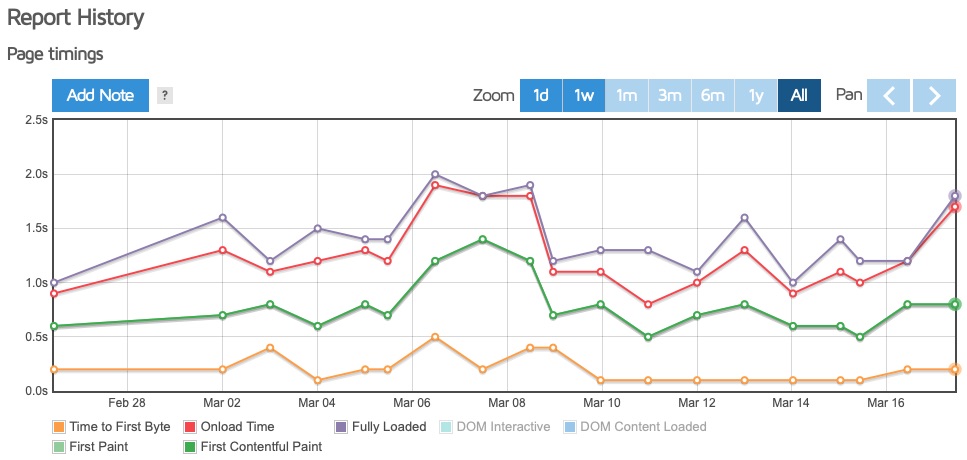
GCP last week
Amplify last week
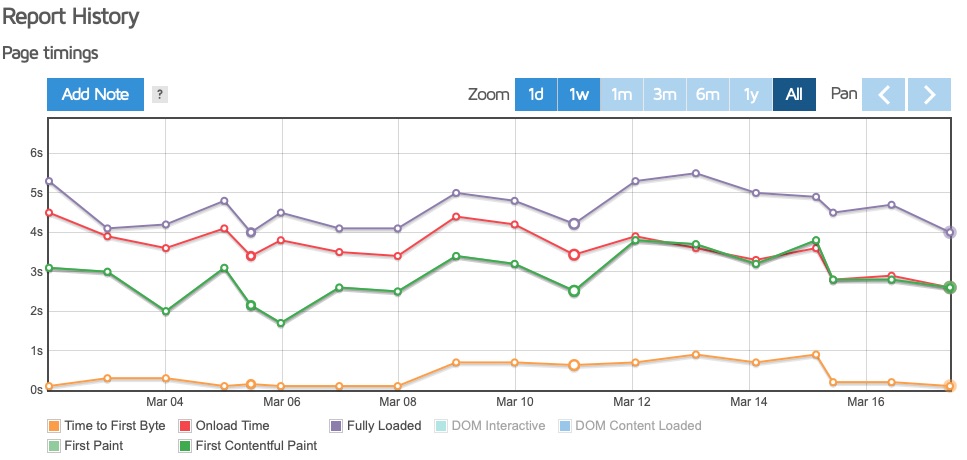
The key takeaway was that the time to paint, a critical user-perceivable metric, was consistently higher via the Amplify solution from this test location. GTmetrix describes first paint time as:
First paint time is the first point at which the browser does any rendering on the page. Depending on the structure of the page, this first paint could just be displaying the background colour (including white), or it could be a majority of the page being rendered.
The monitoring interval was still daily, and this was a single location so we can’t establish anything more concrete.
Indeed, when I use another test location, we get comparable results to Firebase:
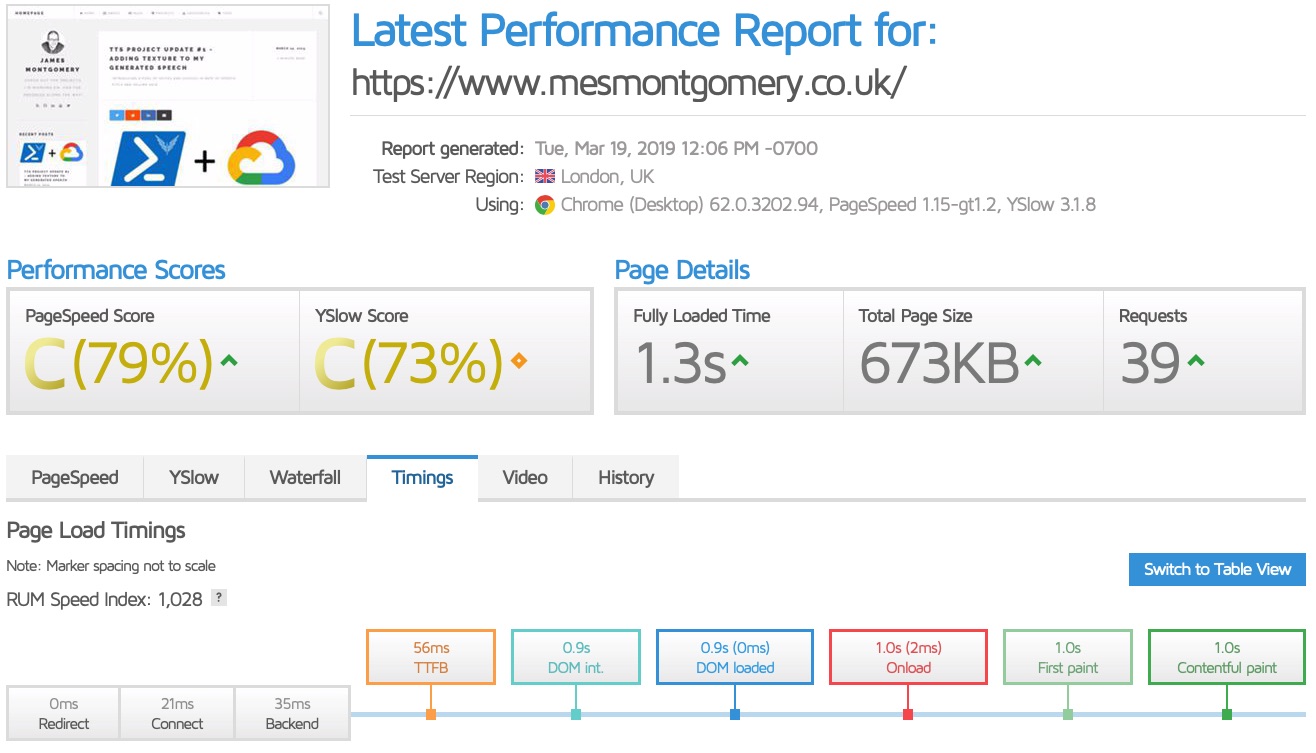
In all likelihood, this is a location-specific issue whereby it is using a sub-optimal edge or related connectivity, assuming all other factors in the test are equal. But what if it wasn’t? I delved deeper.
Getting into the weeds
I noticed via GTmetrix that the caching of the items were low TTL relative to Firebase. Five seconds vs 1 hour.
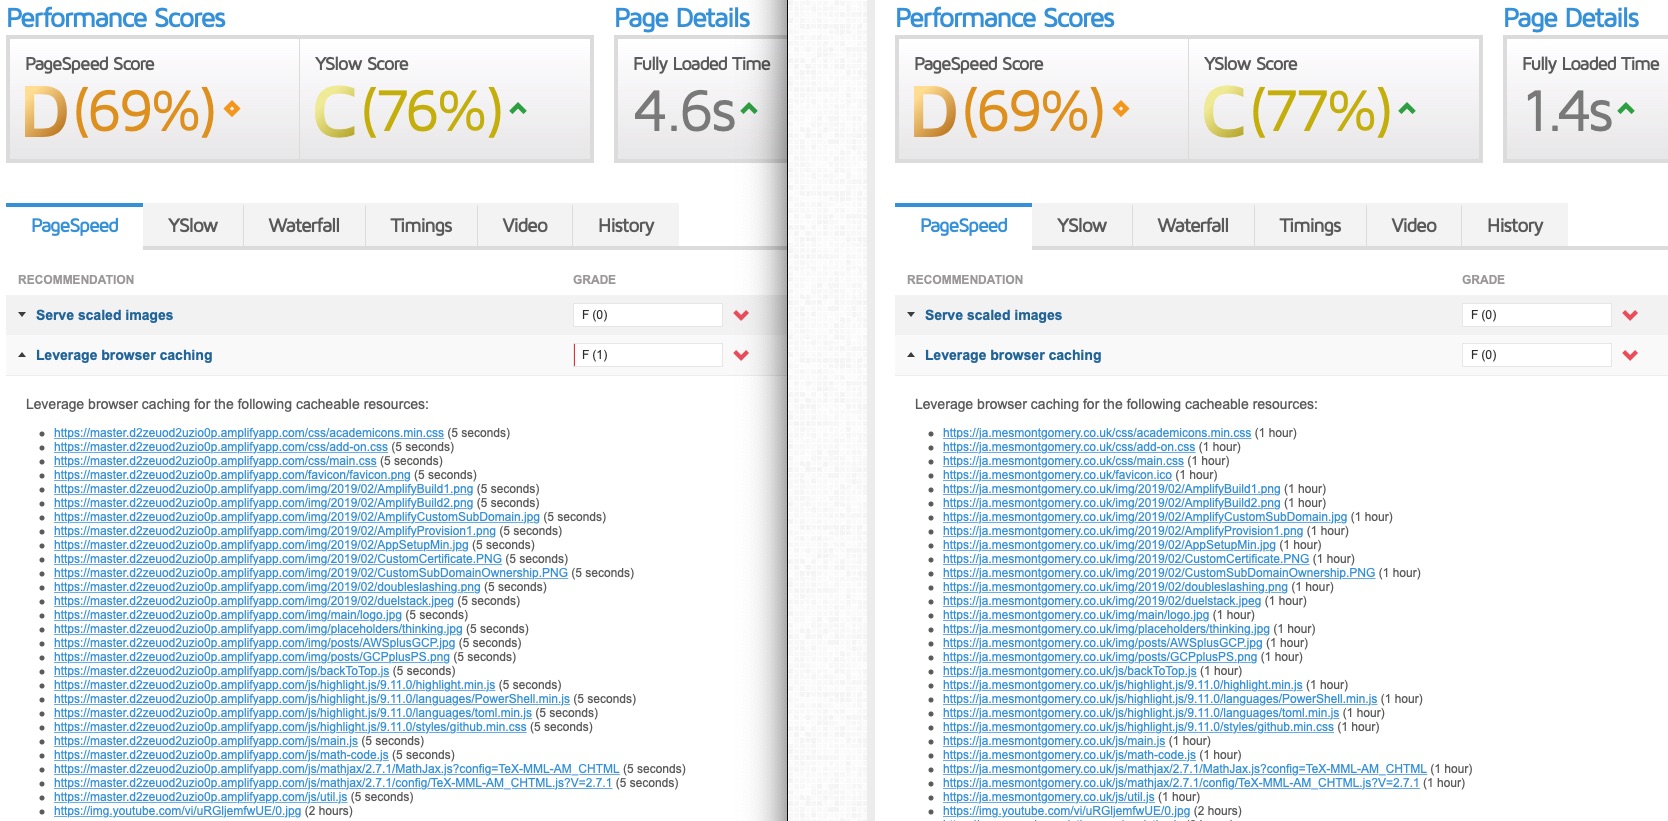
I hypothesised that perhaps there was less edge caching. Here is the quote from the Amplify user guide on the impact of TTL selection:
You can control how long your objects stay in a CDN cache before the CDN forwards another request to your origin. Reducing the duration enables you to serve dynamic content. Increasing the duration means your users get better performance because your objects are more likely to be served directly from the edge cache. A longer duration also reduces the load on your origin.
Updating the TTL was straightforward:

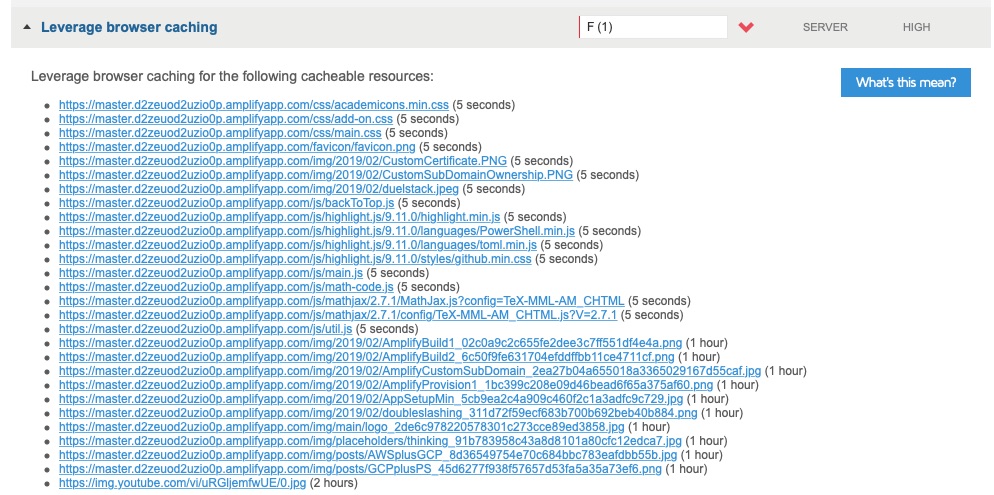
The Amplify documentation on application performance was recently updated to reflect their instant cache invalidation approach. The observed TTL changes were consistent with that approach.
Rather than go more in-depth at this point into trying to understand the Amplify stack, I put CloudFlare proxy in place to force caching of all items at a value greater than or equal to Firebase. The performance from this location was unchanged.
It was time to take a step back - this was not how to draw a horse:

A broader view
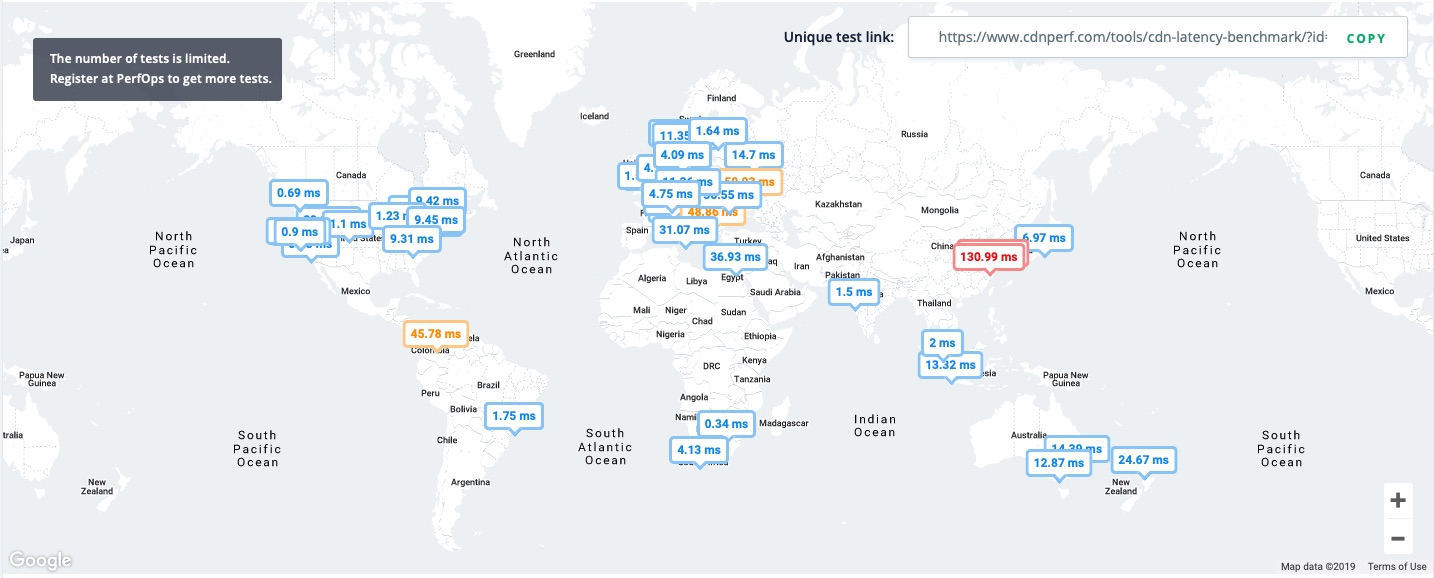
I considered how you might operationally support multiple CDNs and assert confidence in parallel content delivery. For that outcome, I’d need to measure within the context of CDN performance domains. CDNPerf emerged as a relevant tool as did the associated PerfOps product. We can see here the geographical differences via these point in time tests from CDNPerf test locations around the world:
Firebase Global Latency
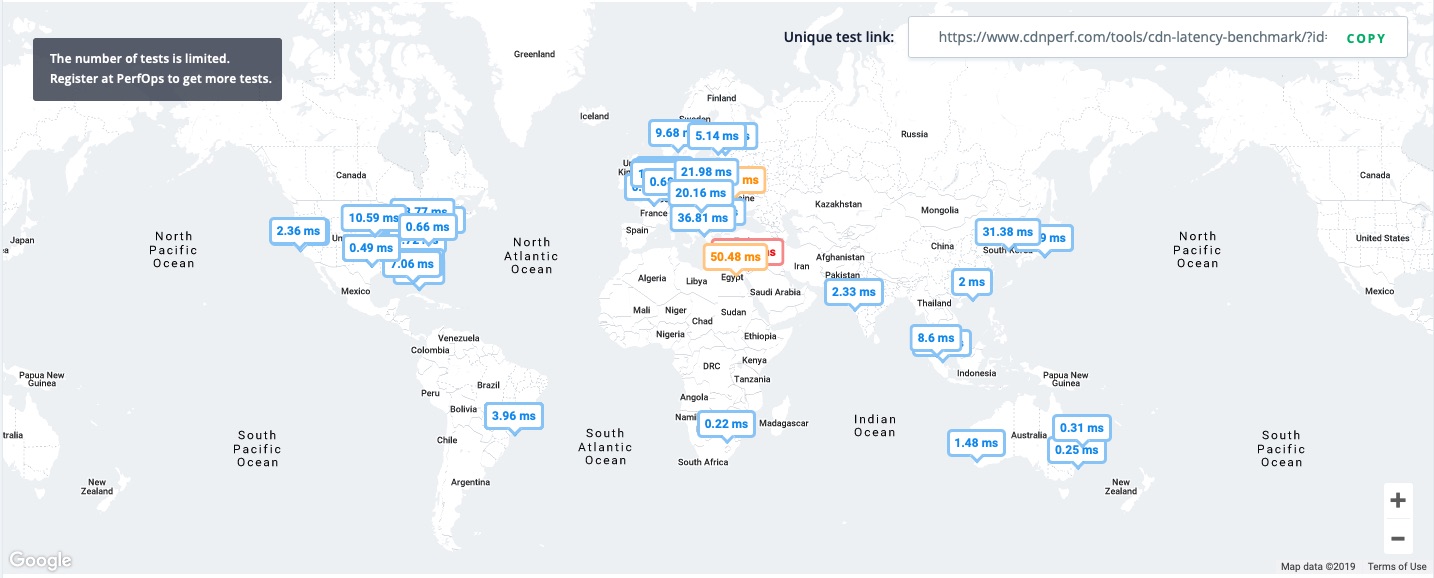
Amplify Global Latency
PerfOps and Flexbalancer
The FlexBalancer service was an unexpected find. It appeared to take metrics such as the user experience and geo-proximity in consideration of providing a DNS based response. The product was not generally available when I enquired; however, the PerfOps team were kind enough to give me access to their open beta.
I’ve had some time to experiment with it - their product is a novel approach to traffic steering, and I hope it does well. At the time of writing, there was a free-tier on the pricing page, and I hope to take advantage of it upon launch.
In conclusion
As I based this site on a template, I’ve had to understand how it works before I could reach conclusions on content performance. To complicate matters, the CDN used for primary content delivery is only part of the user experience due to external resource dependencies.
A multi-platform approach must have value. That value might be the experience of learning, content delivery performance assurance, or it might be one which roots itself in survival. It is interesting to see the tools and services develop in this space. PerfOps’ FlexBalancer has a somewhat “cake and eat it too” potential when it comes to the use of multiple CDNs.




Share this post